
Introducing Infobites!

EDAHN SMALL is the Creative Director at Hypothesis and the leader of the Gridspace Collective, the in-house design team at Hypothesis.. He and his team design reports, presentations, infographics, and print leave-behinds for the world's best brands.
What is an Infobite?
This week we launched our official Instagram page (@hypothesisgroup). Instead of a typical corporate instagram page, though, we wanted to do something unique that showcased our skills and personality. We also wanted to offer something of value that was original. Enter the Infobite.
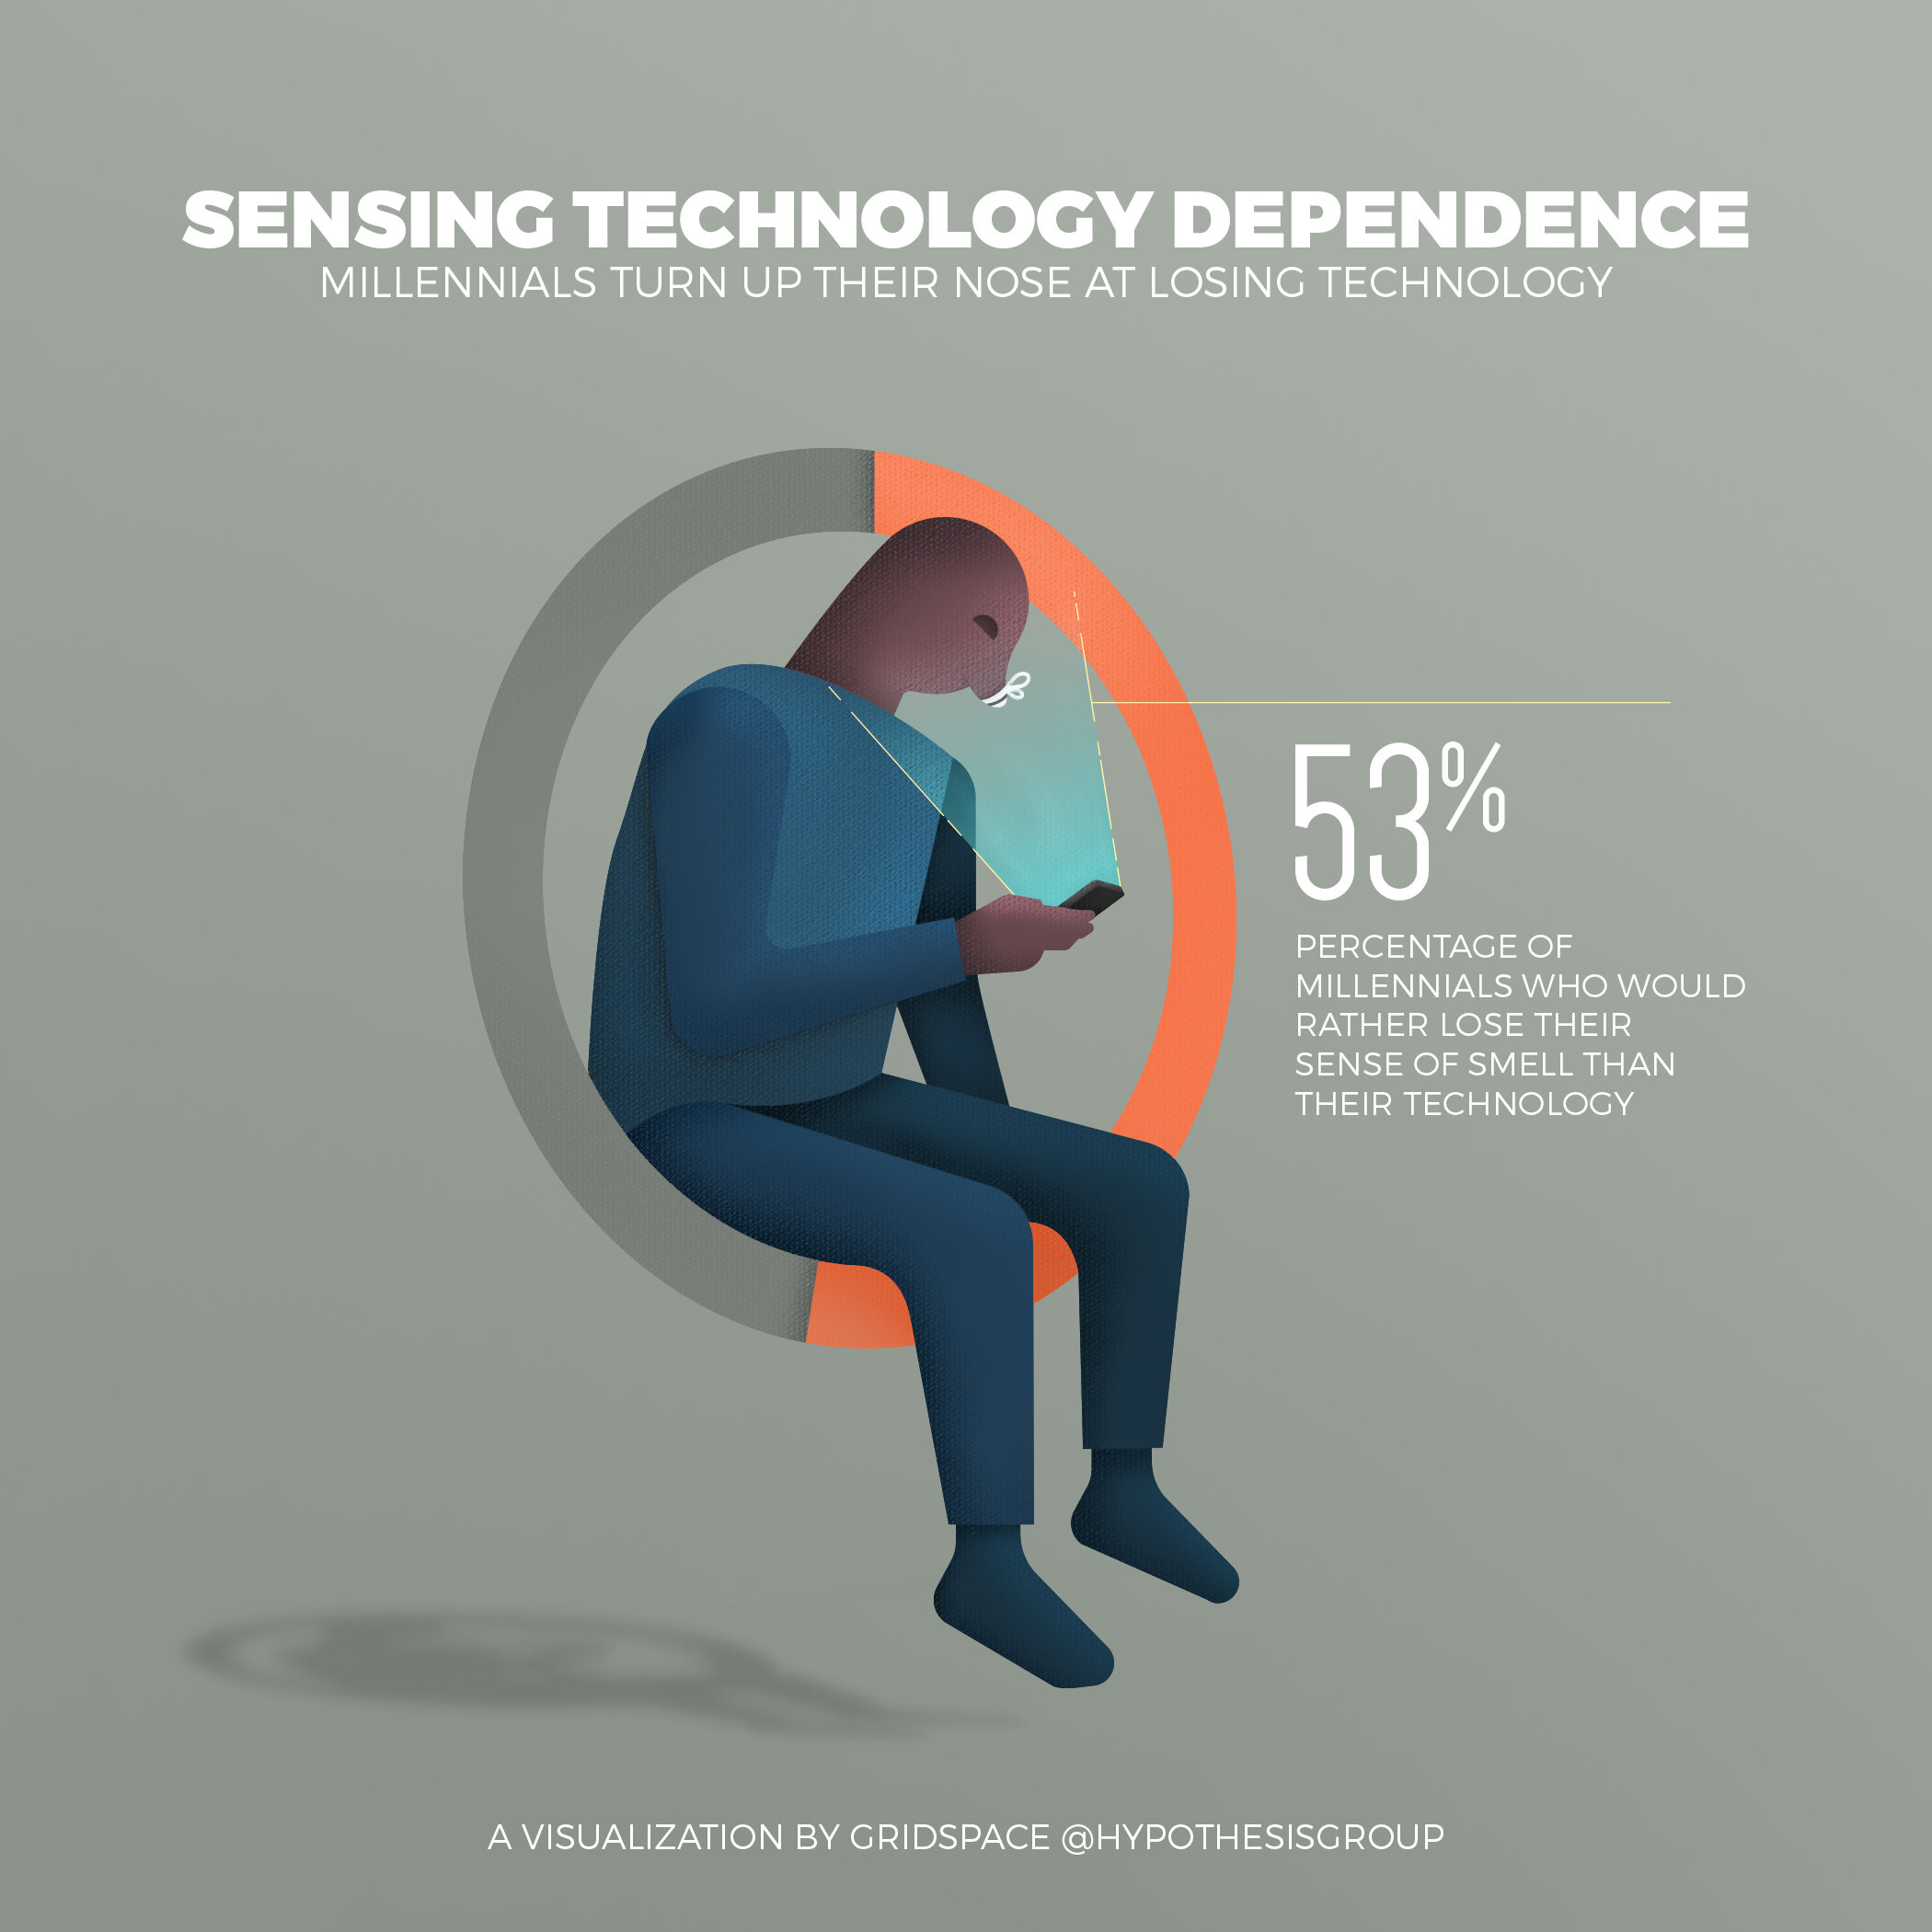
The Infobite is a new species of shareable content created by Hypothesis. It's a hybrid of traditional infographics with small, shareable memes. We blended the data and design richness of modern infographics with the bite-sized portions of viral content. Infobites give users small, quick pieces of information, visualized beautifully by our design team.
The Infobite is geared towards today's mobile users. According to research by comScore, mobile users account for at least 60% of digital consumption on the web. Mobile users also prefer watching short-form content to long-form videos, according to ad platform FreeWheel. Keeping with this trend of smaller, snackable content, we created something that can be easily understood, enjoyed, and shared. The more shareable the content, the greater impact it can make.
6 Guidelines for Creating Your Own Infobites
We put together a few guidelines to help you make and share your own Infobites.
1. Have one strong focal point
If you have more than one focal point, the Infobite becomes an infographic and stops being easily consumable. One focal point ensures that users can quickly intuit the meaning.

2. Show a relationship or a surprising data point, but don't get too complicated
Avoid the temptation to layer too many numbers on the Infobite. Keep it simple and manageable, and think about what your audience is able to remember. Too many data points means your viewers won't be able to remember anything and worse, will avoid engaging with the content.

3. Make it obvious
The viewer should be able to capture the point of the Infobite in 5 seconds or less, preferably without reading any words.

4. Visualize the data in an interesting way
Visualizing the data in a creative, interesting way will help generate interest and motivate sharing.

5. Avoid clutter and "chartjunk"
Don't overdesign the Infobite. Edit ruthlessly and remove anything that doesn't need to be there for the point to get across. "Chartjunk" like gridlines and axes should be removed unless they're completely necessary.
6. Choose data that is reliable and sourced
Just as with infographics, always source your information in case someone needs to look it up or wants to do more research. On Instagram, for example, we source our material in the comments.
For more information, contact Edahn at esmall@hypothesisgroup.com.